Histogram and Its Application to Image Analysis
Published:
Histogram Equalization
EE7403
In this assignment, I learned about the definition and the properties of the Histogram and it’s applications such as Histogram Equalization and Otsu’s Method. I also compared histogram of different style of images. This assignment discussed the Pros and Cons of the Histogram Equalization.
Setup on which the code was tested
- python==3.7
- numpy==1.19.2
- pillow==8.2.0
- opencv-python==4.5.1.48
Histogram of the Image
Histogram of an image is a statistical table that reflects the distribution of pixels in the image. The vertical axis shows the total number of the pixel in that tone, while horizontal axis represents the tonal variations. In horizontal axis, from the left side to the right side corresponds to the brightness from 0 to 255. A histogram of a picture f (x , y) is a discrete function:

Definition of the Histogram
I increase/decrease/scatter/concentrate the gray-level of the image respectively and get the following results:
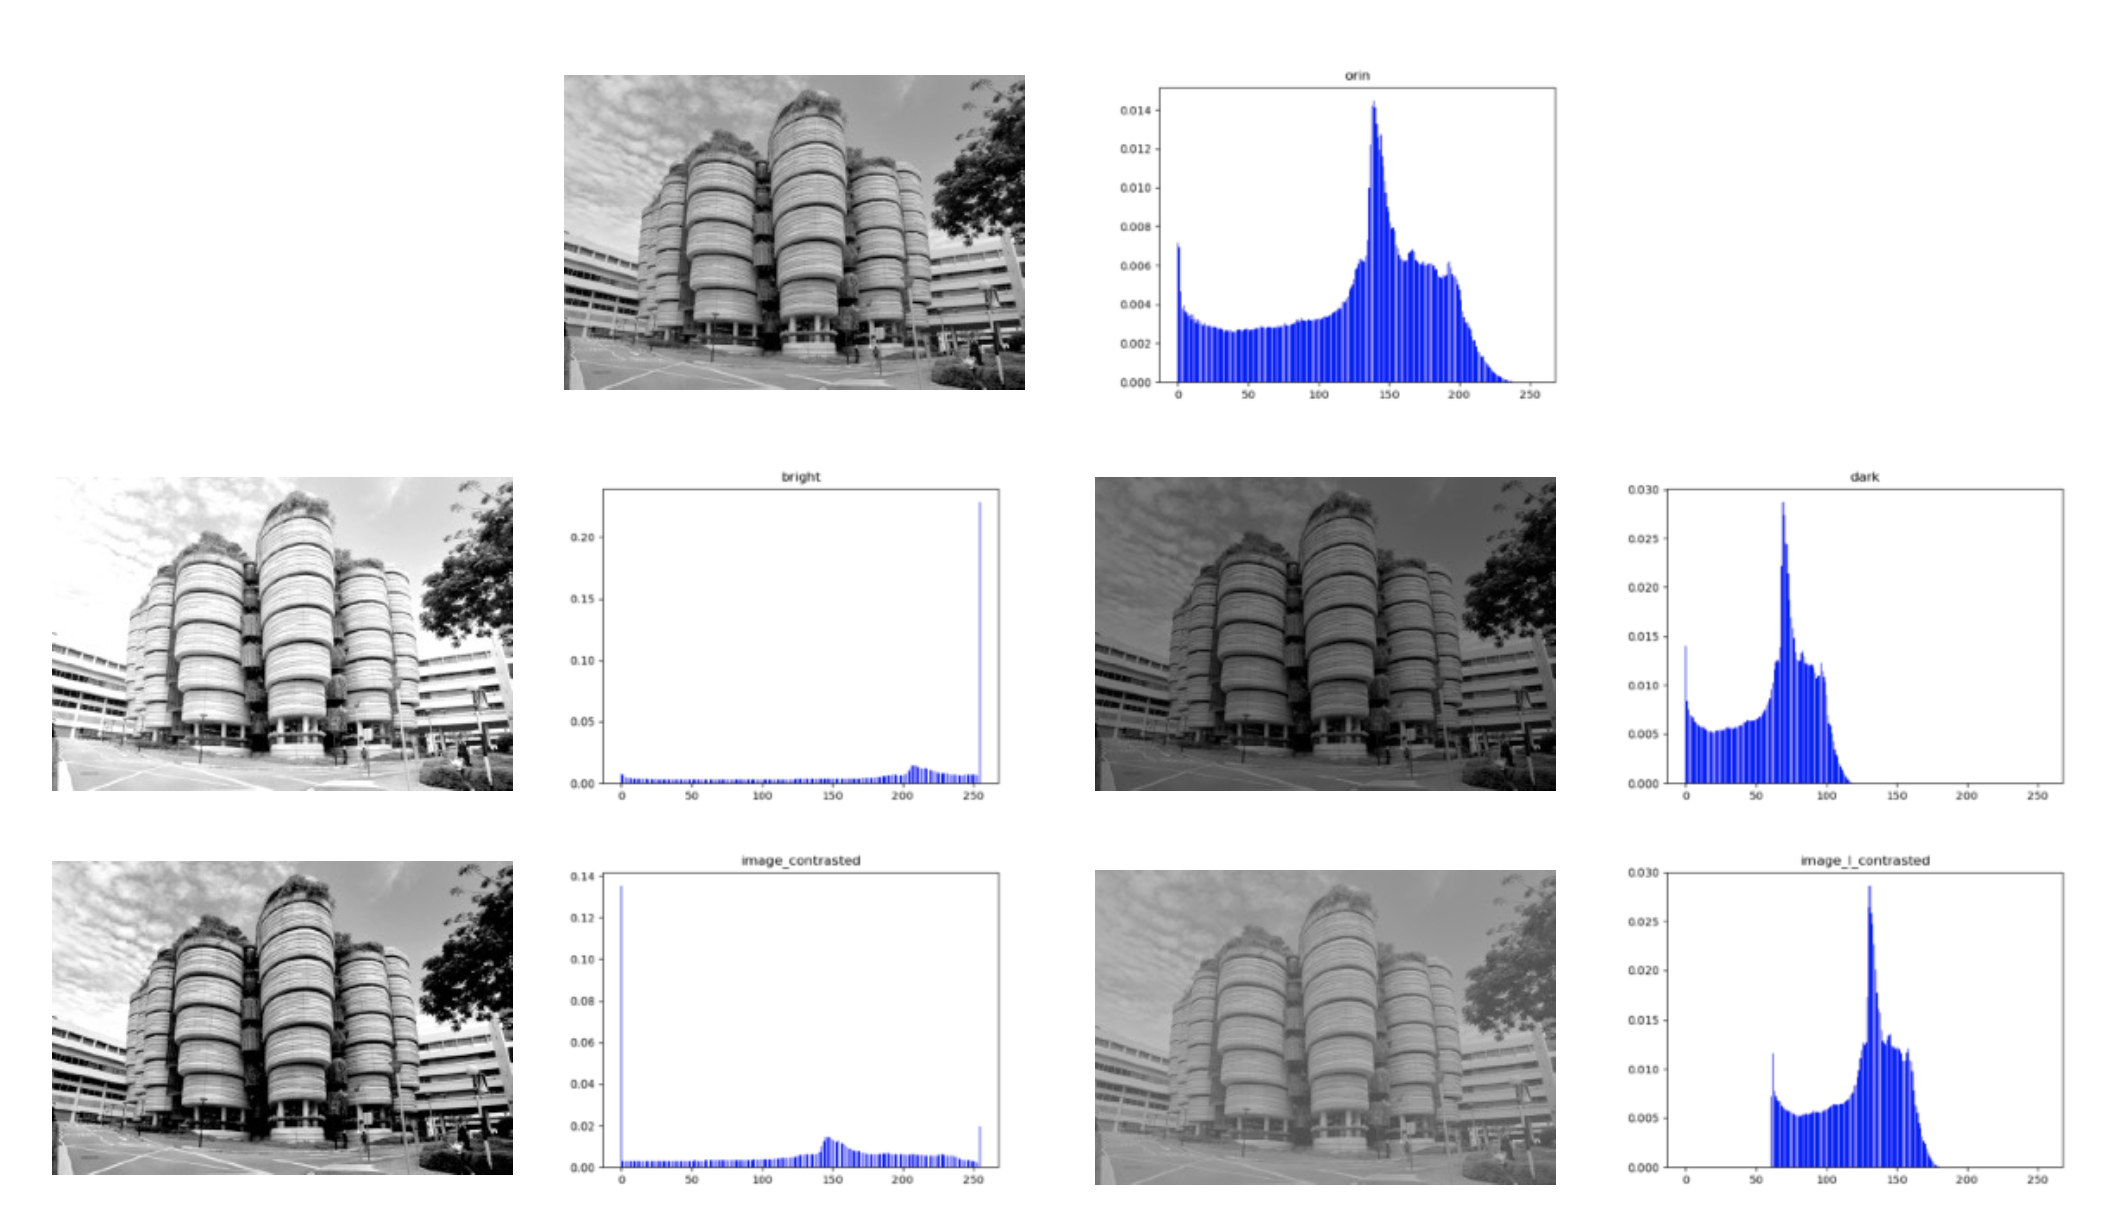
Changed in the grey-level of a picture.
Histogram Equalization
A. Overview
Histogram equalization is a method that to increase the contrast of a picture, and its main idea is to adjust the histogram distribution of the image to a more uniform distribution, thereby increasing the contrast of the image. It is a very powerful and very classic algorithm.

Definition of the Histogram Equalization

Histogram Equalization
B. How to do it

Otsu’s Method
By denoting a threshold in grey-level, we can segment one picture into two images. The original image and its histogram are shown below:
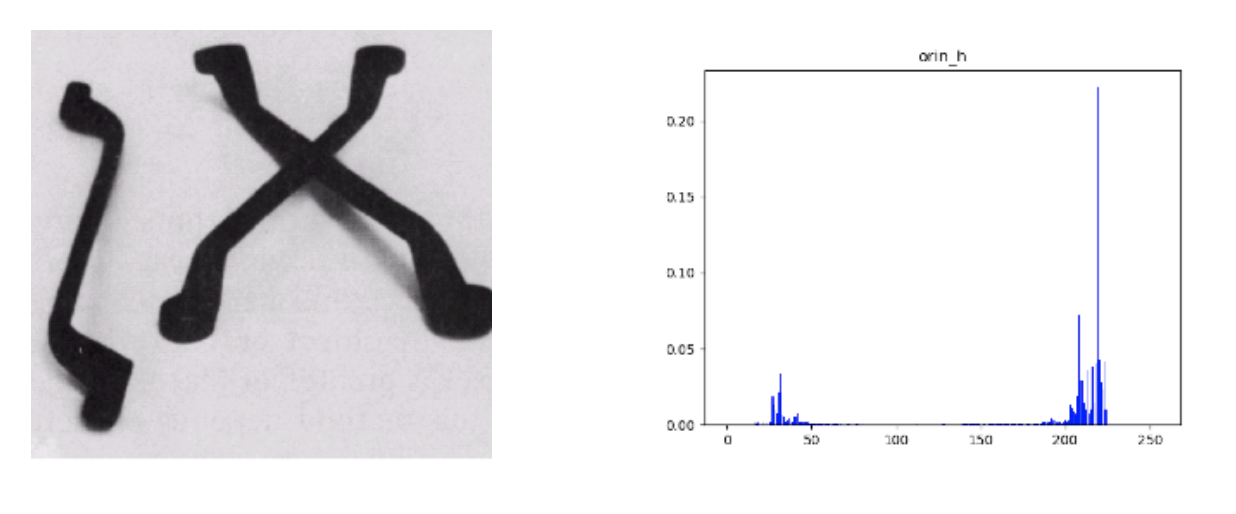
I chose grey level = 100 to be the threshold and got the binary output below:
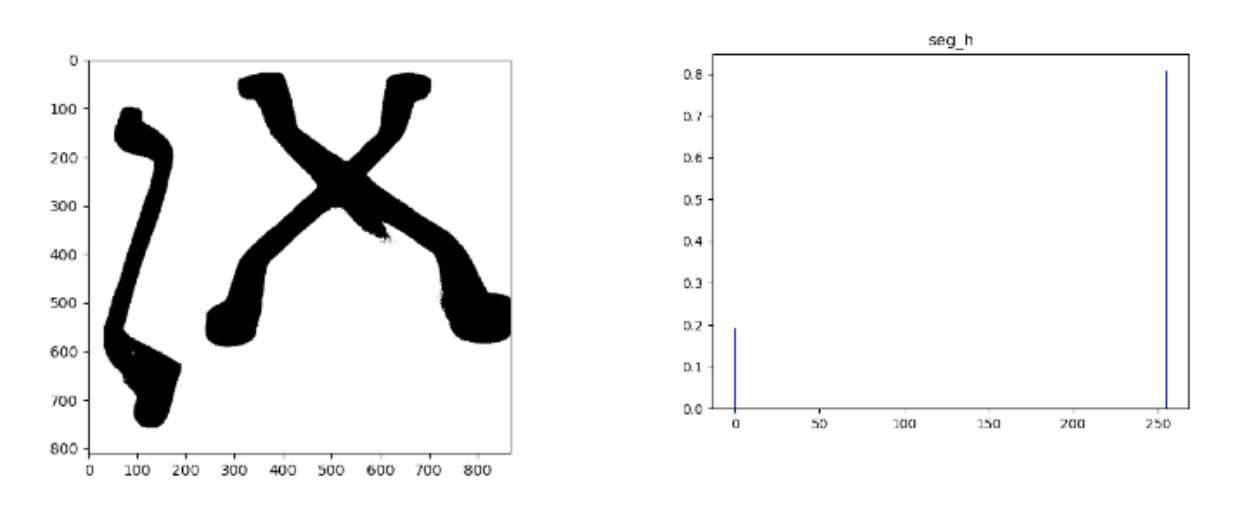
Issues
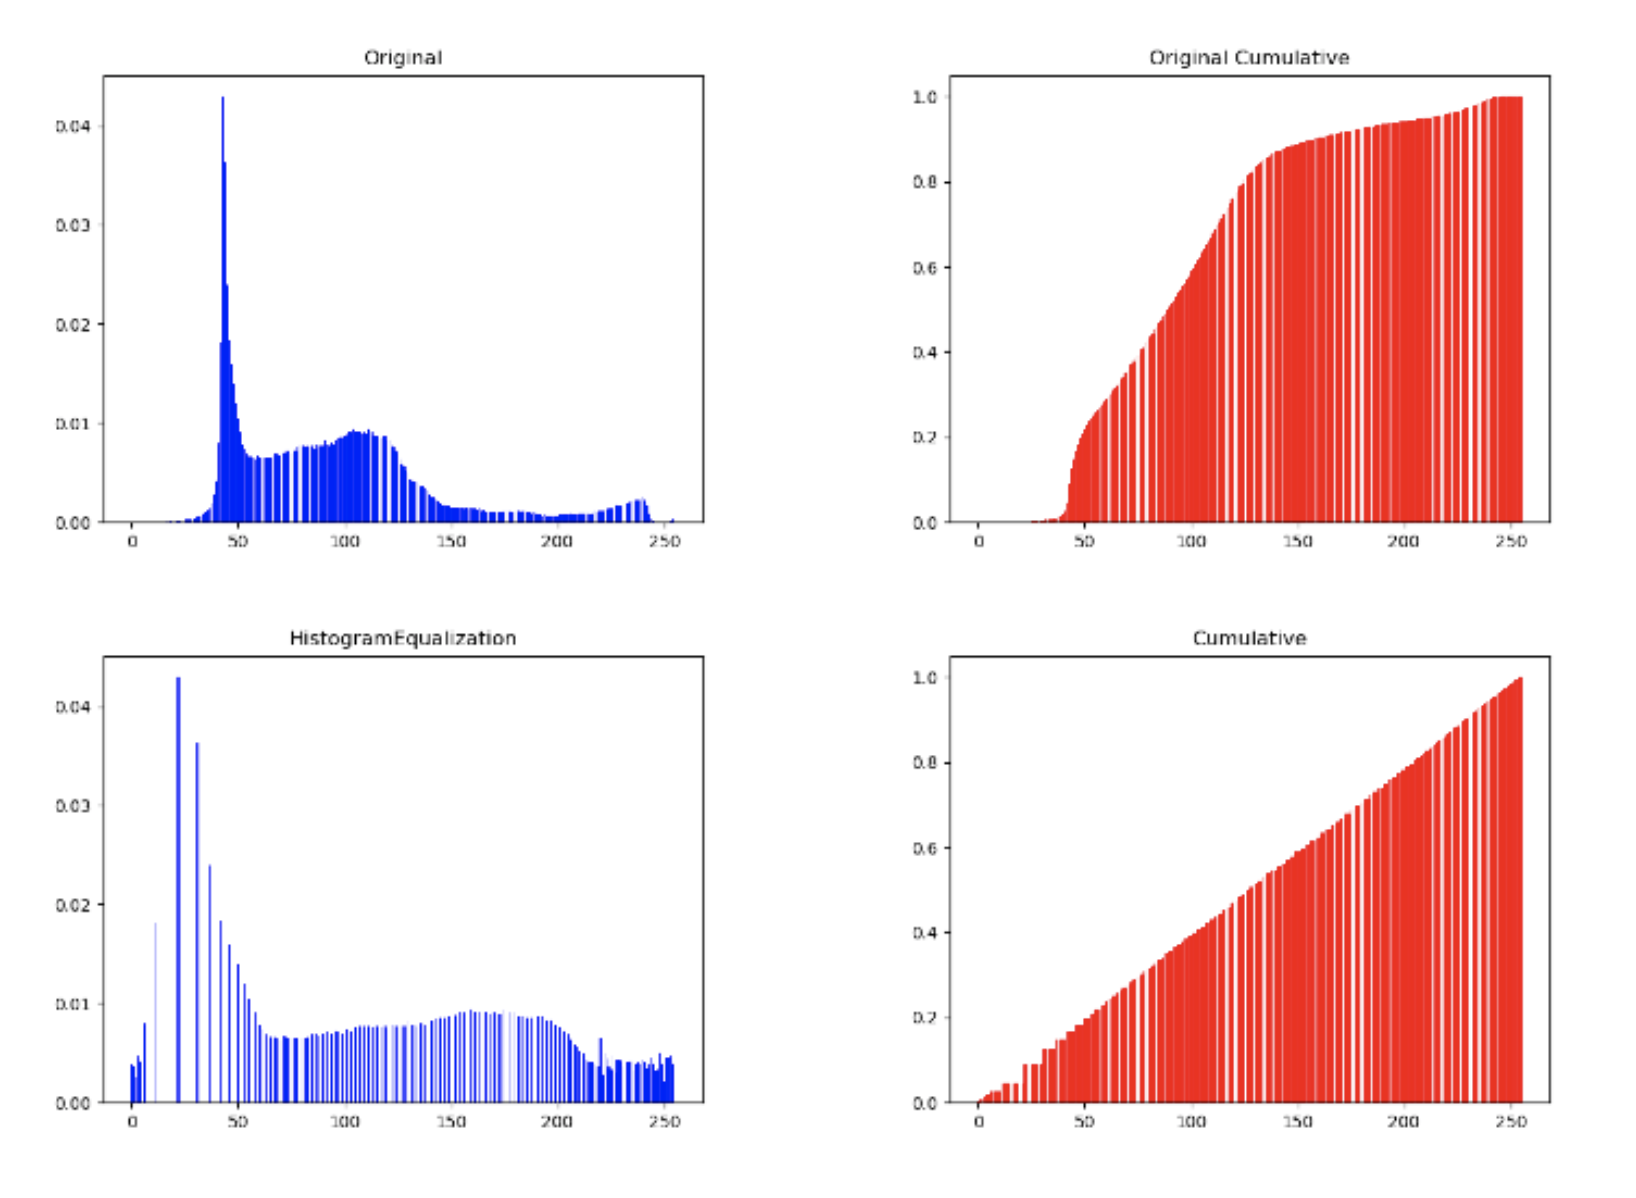
If the mapped gray level is less than 256, there will be some gray level vacancies in the transformed histogram. That is to say, the probability of the gray level after adjustment cannot basically obtain the same value, so the histogram generated is not completely flat. After the equalization, the histogram of the image has quite big gaps at [0, 50] like this:
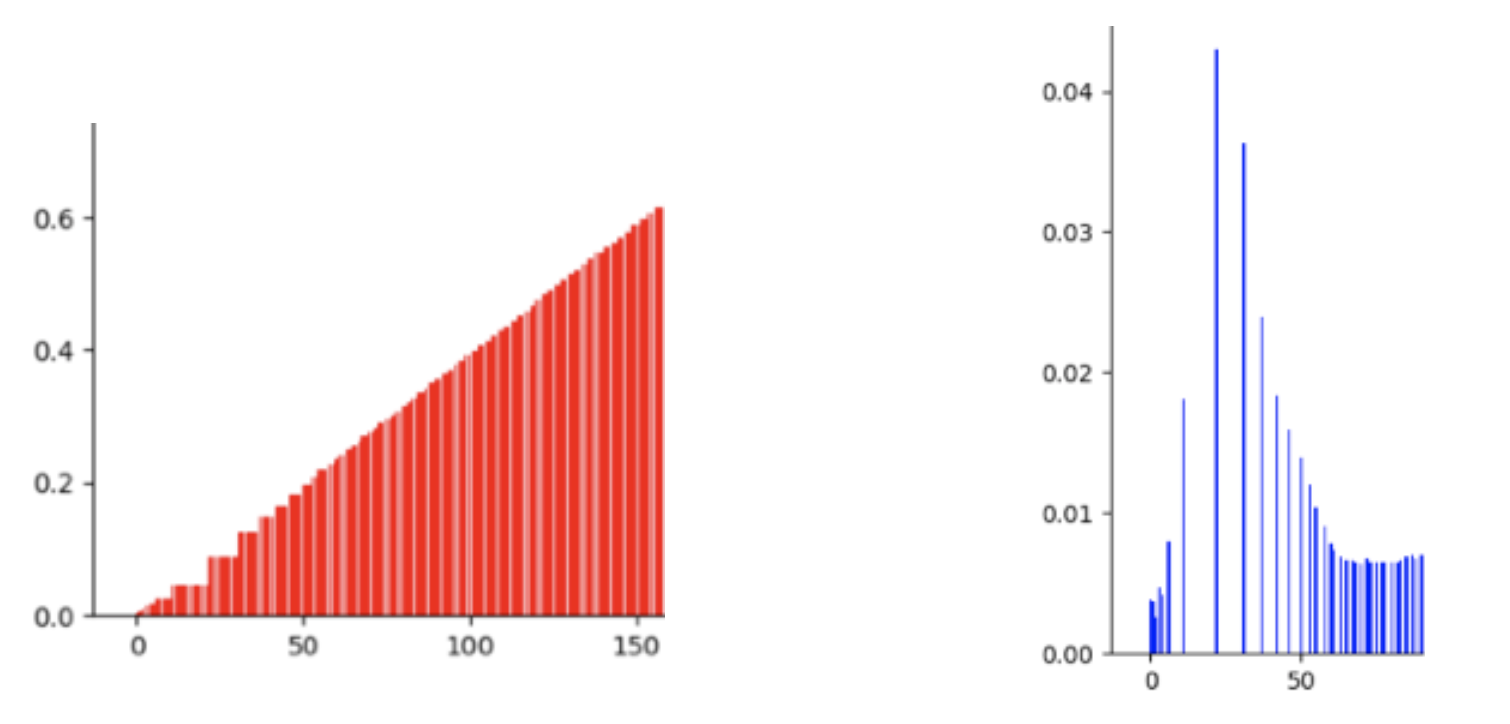
It is because the great values between [0,50], The grey-level after Histogram Equalization is sparse.
Contact
The above is the a brief description of simple application of Histogram Equalization and Otsu’s methond. If you encounter unclear or controversial issues, feel free to contact Leslie Wong.

